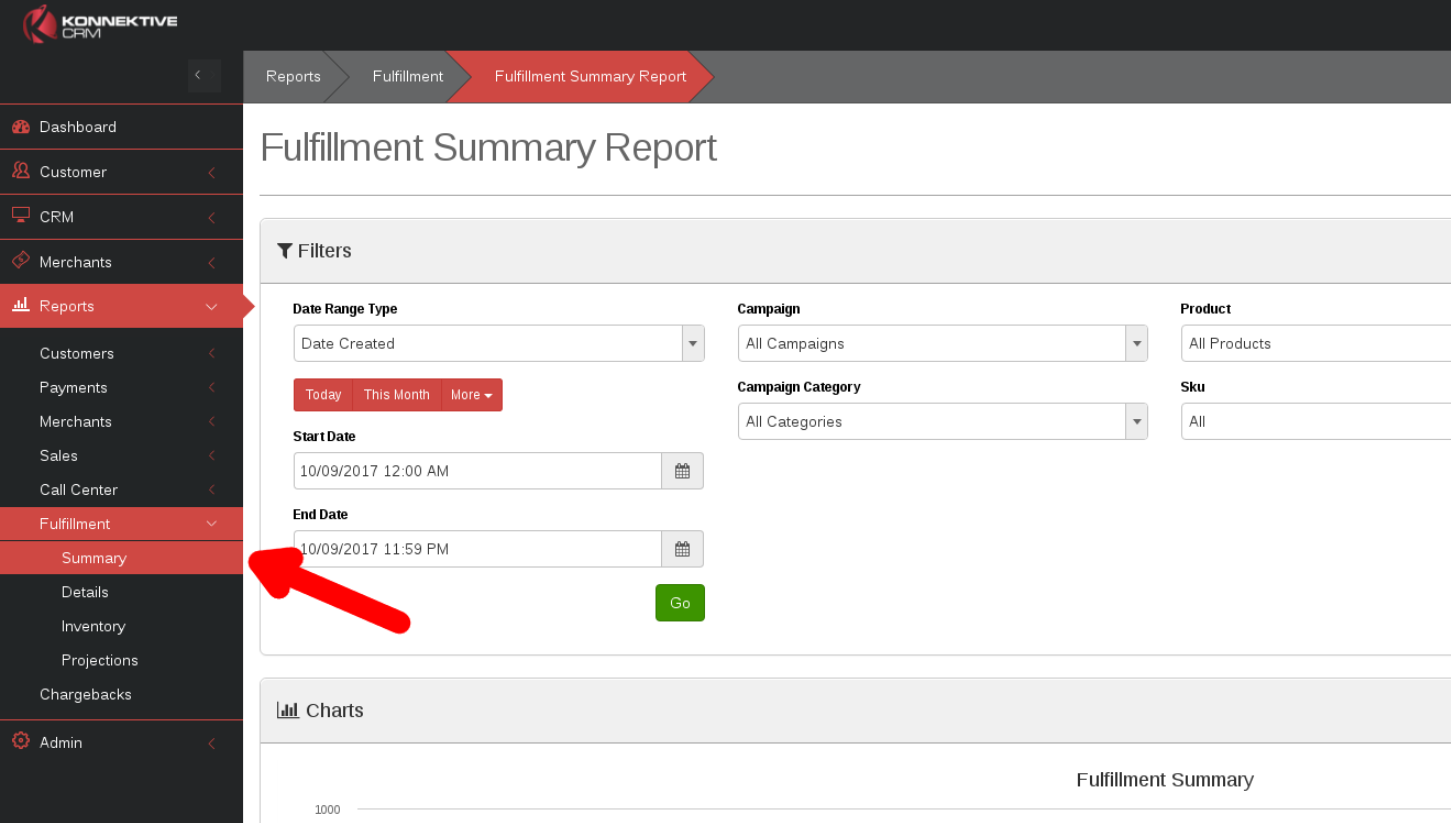
The Fulfillment Summary Report shows a visual representation of fulfillment data based on how may items that has been purchased within a range of parameters specified by the user.
Fulfillment Summary Parameters
The fulfillment Summary report can return data based on predefined parameters like the date range which can be showed differe nt ways
The date range can filter data based on the date the fulfillment was created, the date the item was shipped, date the item was returned or the date the item was orders. From there you can specify how much data you want to return, the quick date selectors are 1 day, 1 week, 2 weeks, 1 month, 3 months, 6 months and 1 year worth of data or you can specify a specific start date and end date.
Refine By Order:
The refine by order section is where you want to give parameters based on what type of data you want to see. The Parameters are Campaign, Campaign Category, Product, Company, and Fulfillment status.
Fulfillment Summary Table

The Fulfillment Summary Table shows data based on the fulfillment status and how much revenue was generated from that product based on the parameters that was defined from the date range and refine by order section. This section will also show if the item was bundled with another item. You might have notice there are 2 tabs to choose from, by product and by campaign. The by product section is chosen by default and breaks down the data based on each individual product and their ID and the by Campaign section shows the table based on each campaign that was created also the by campaign tab has a drop down that shows how which products belong to that campaign.
Fulfillment Summary Chart
 Fulfillment Summary DetailsThe fulfillment summary chart shows a visual of how much revenue generate from each item based on that items SKU number, each time you change the parameters from the date range or refine order section the chart updates.
- ID : Id of product or campaign
- SKU : SKU of product
- Quantity : Total product quantity per product/campaign
- Hold : Number of fulfillments on hold per product/campaign
- Pending : Number of fulfillments in pending per product/campaign
- Pending Shipment: A tracking number has been assigned to the package and is ready to be picked up by the carrier
- Shipped : Number of fulfillments shipped per product/campaign
- Delivered : Number of fulfillments delivered per product/campaign
- Cancelled : Number of fulfillments cancelled per product/campaign
- RMA Pending : Number of fulfillments in RMA Pending status per product/campaign
- Returned : Number of fulfillments in Returned status per product/campaign
- Failed : Number of fulfillments in Failed status per product/campaign
- Sub Total : Sum of the Base cost of offer for all fulfillments in row
- Shipping : Sum of Shipping cost of offer for all fulfillments in row
- Sales Tax : Sum of Sales tax applied to offer for all fullfillments in row
- Gross Rev. : Sum of Total amount paid for offer for all fullfillments in row
- Refunds : Sum of Refunds issued against product/campaign for all fulfillments in row
- Ship Cost : Sum of All Shipping costs for all fulfillments in row
- Net Rev. : Sum of (Total transactions for all fulfillments in row less shipping costs and refunds)
- Bundled : Number of bundles per product/campaign

